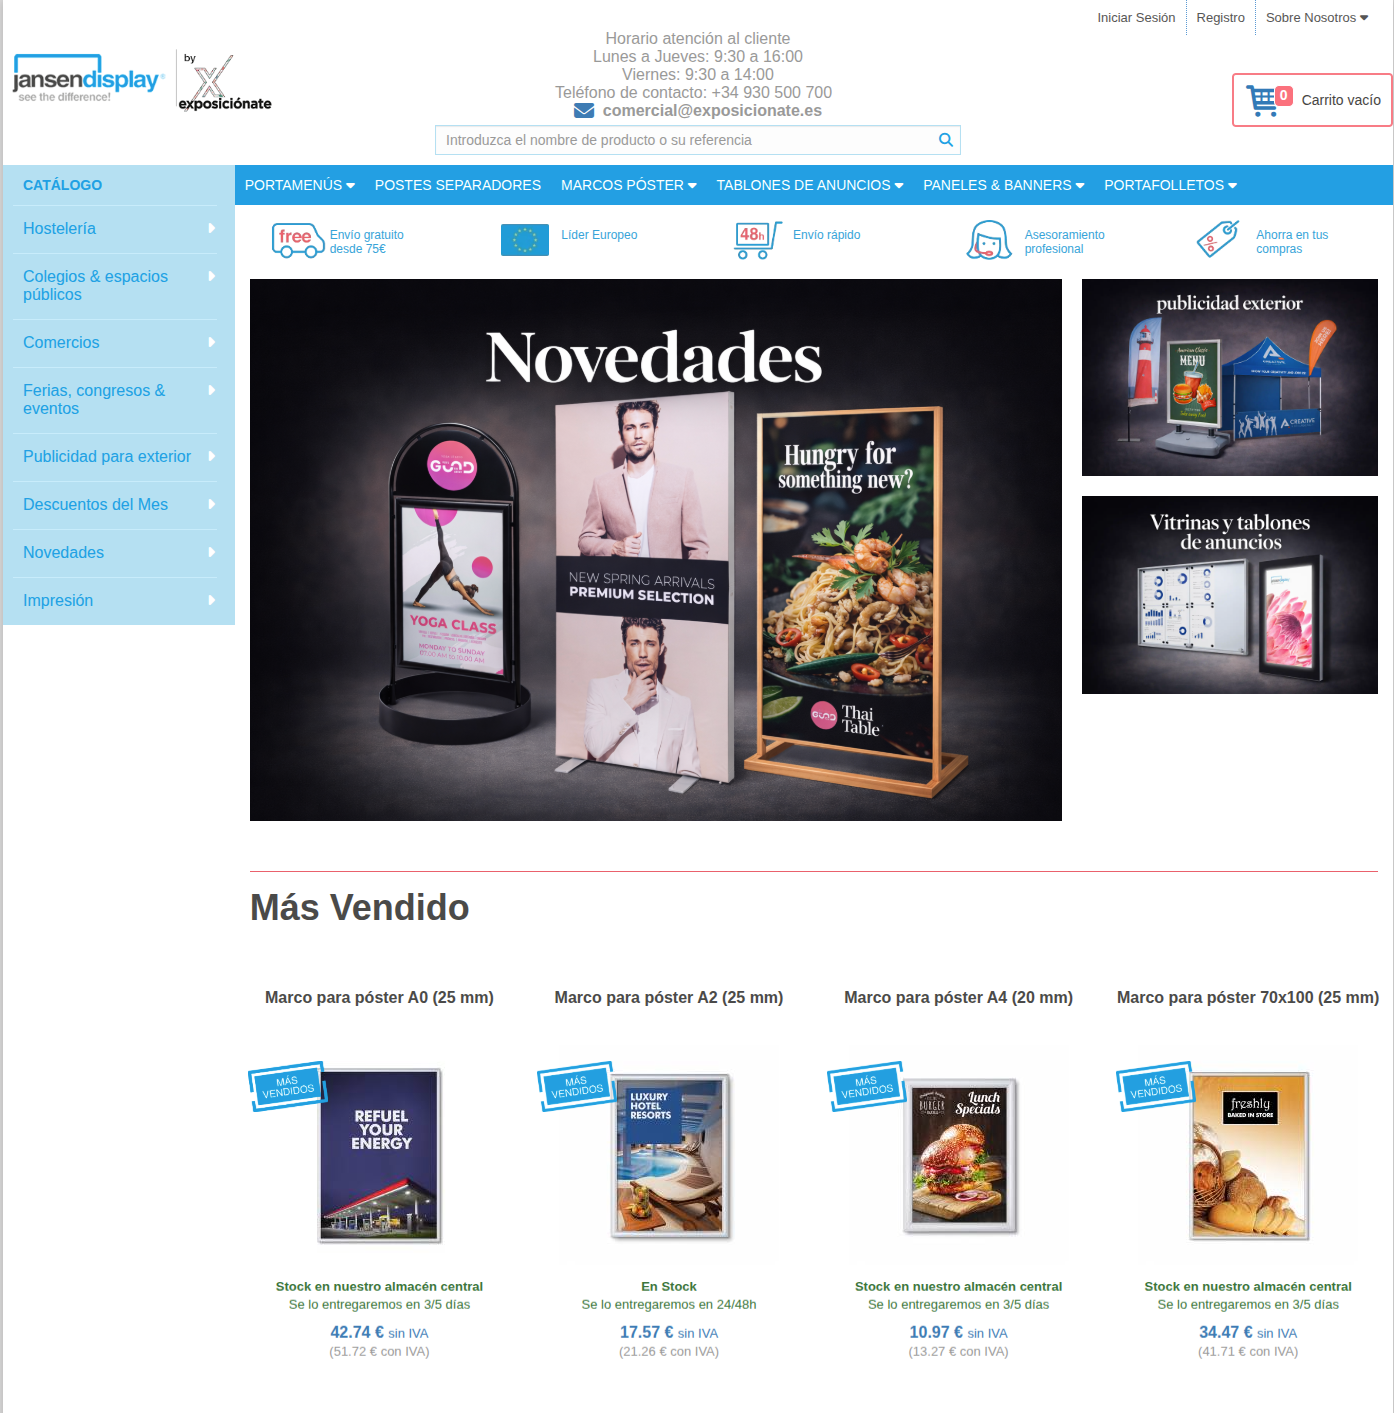
Jansen Display
From an online store with barely any sales to the leader in communication display products in Spain. Ten years of continuous management, expansion to Germany, and ROAS always above 4×.
×5
Revenue growth in Spain (2016–2020)
7.2×
Peak ROAS (Spain, 2020)
+42%
Year-on-year growth in Germany (2018–2019)
10 years
Continuous partnership
Starting point
A strong product, with little visibility
When I started working with Jansen Display in 2015, I found good products and a broad catalogue, but the digital presence was barely producing results with total sales below €30,000 per year.
The challenge wasn't the product — it was visibility and profitability. They needed to appear on Google at the right moment with the right messages to reach potential customers. And to do it so that every euro of ad spend produced a measurable return.
Starting from scratch: with barely any usable campaign history, no reliable conversion tracking, and a catalogue of hundreds of references that needed prioritising. In under two years, Jansen Display was the sector leader in paid search.
What I managed
Services applied to the project
Timeline
Ten years, market by market
Project launch in Spain. Annual online revenue: < €30,000. Built from scratch: accounts, conversion tracking, product feeds, and campaign structure.
Takeoff. Spend scales profitably and Jansen Display establishes itself as the leading company in the sector in under two years.
German market opened. Simultaneous management of Spain and Germany with independent feed structures and campaigns tailored to each market.
Germany increases revenue by 40% in barely a year with 7.4× ROAS. The German operation is sold as a going concern.
All-time revenue high with 7.2× ROAS.
Business restructuring: B2B-to-B2C model change and change of ownership. Revenue drops, but ROAS holds steady at 4.4×.
Recovery to pre-restructuring revenue levels with a purely B2C model. 5.0× ROAS. The account remains profitable ten years after the first ad.
Results
The numbers, unvarnished
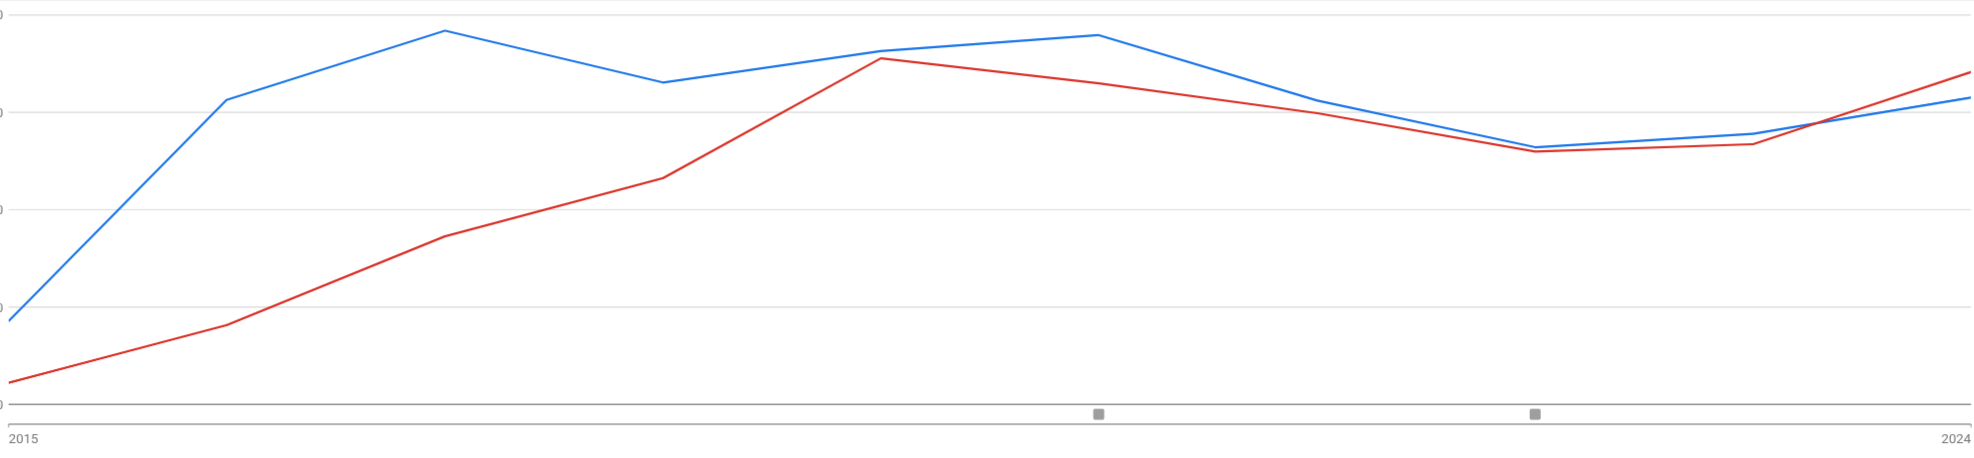
Two markets, ten years of real data. The revenue index uses the first full year in each market as the base (100).
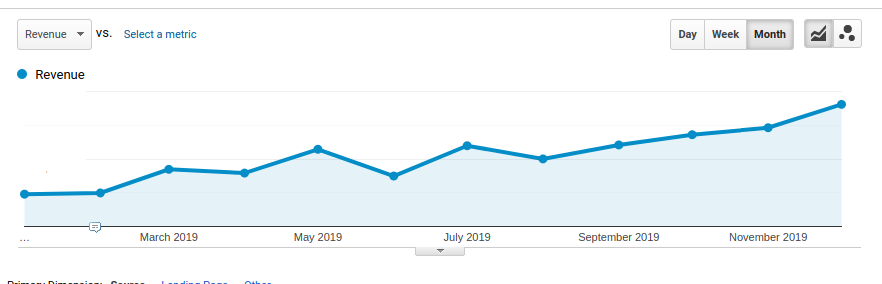
Revenue evolution — Spain (2016–2024)
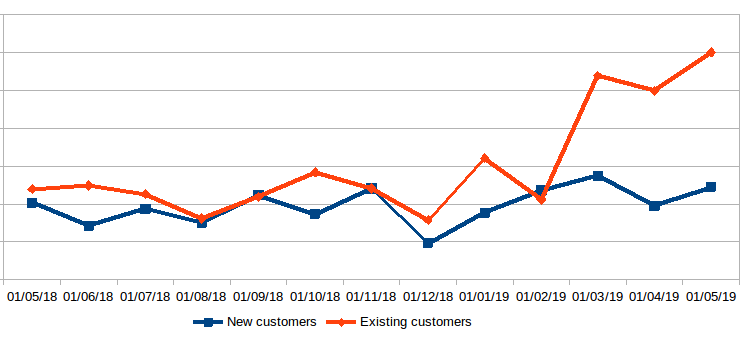
Revenue evolution — Germany (2018–2019)
The German project was sold as a going concern at the end of 2019.
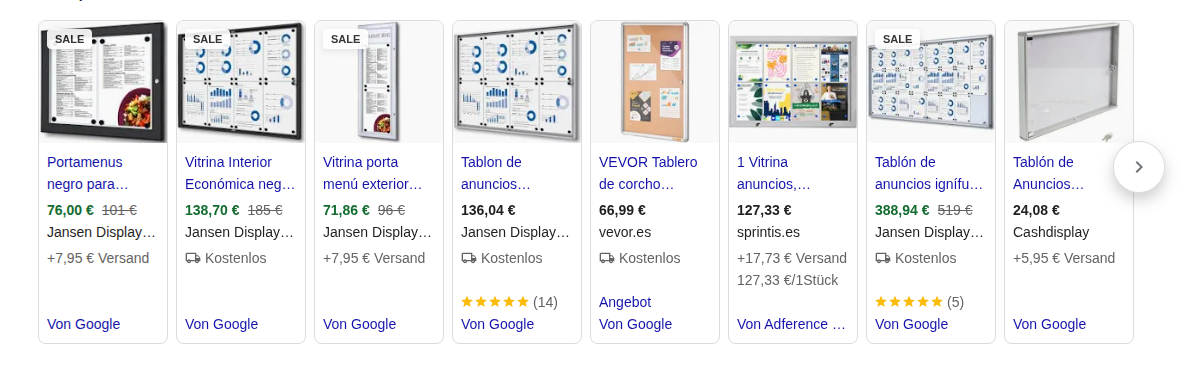
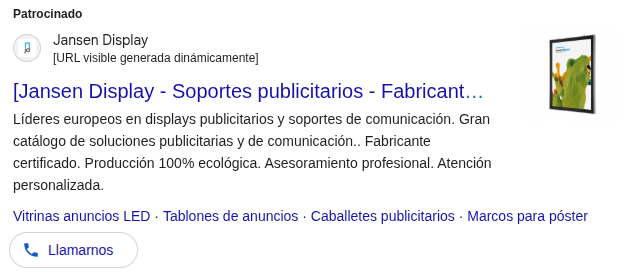
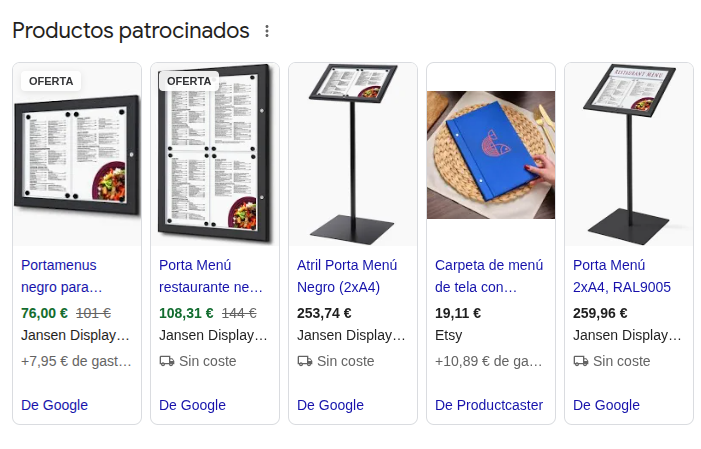
Campaigns in action
Search and Shopping presence
Is there room for your store to grow like this?
Tell me where you stand and we'll review what's holding your campaigns back.